Understanding the relationship between forest management and wildlife habitat in particular requires accurate mapping of forest disturbance history, including low-magnitude events.

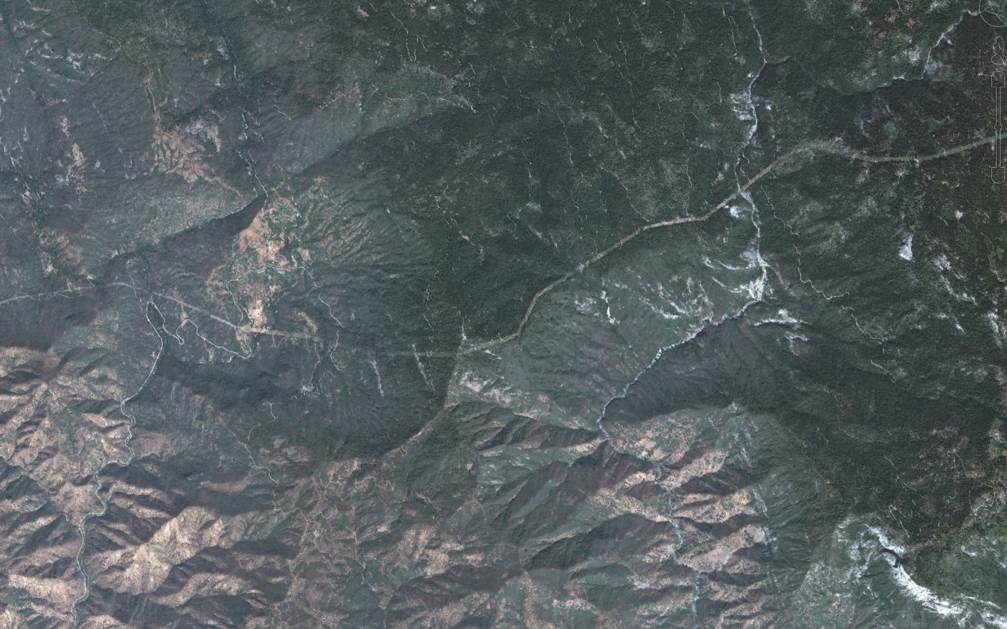
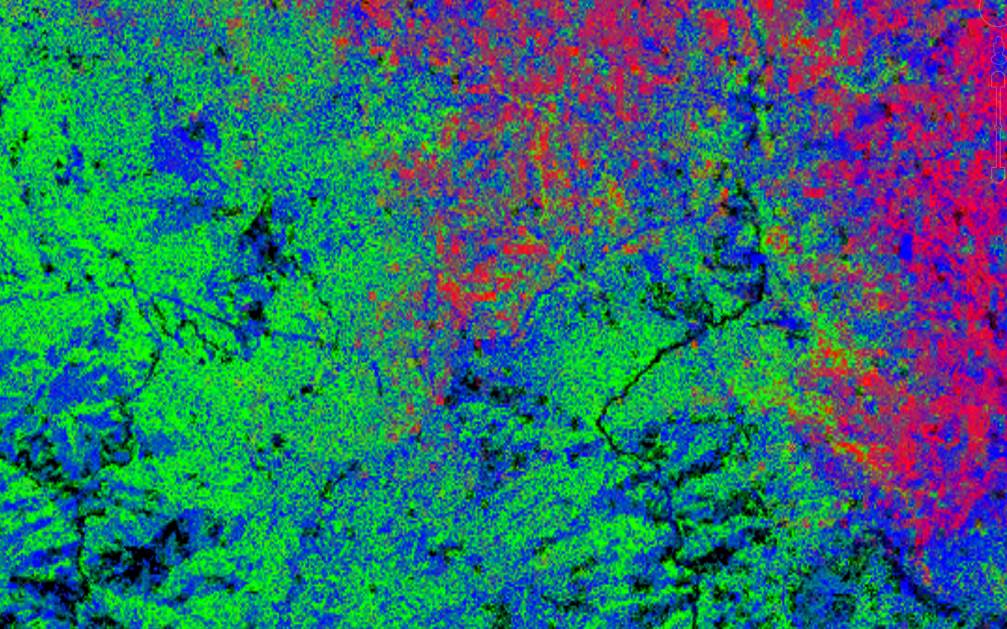
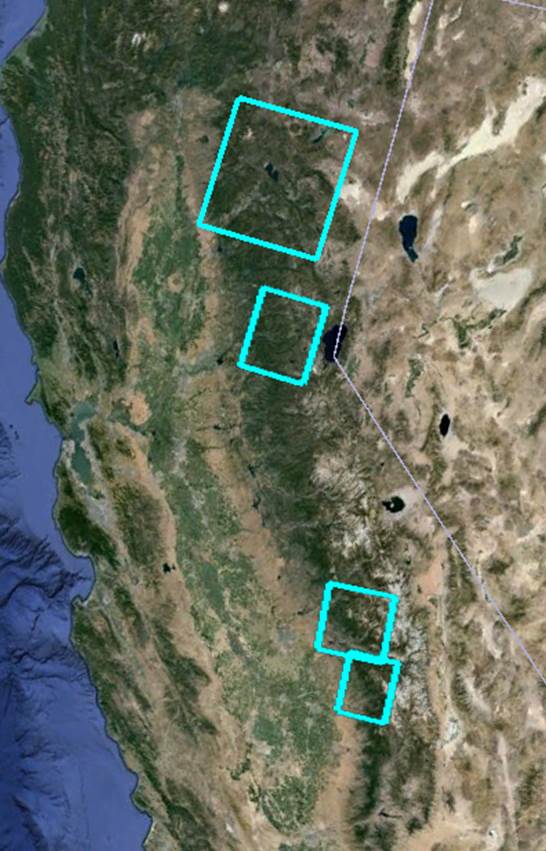
CSTARS and our partners from the US Forest Service Region 5 Remote Sensing Lab combined our image analysis systems,  eDaRT and MixSSMA,  and developed annual maps of tree canopy cover for 1990-2011 in four California Spotted Owl study areas in Sierra Nevada (see image overlay below).  Our collaborators, wildlife biologists, forest ecologists, and other scientists compared these maps with occupancy data and made recommendations how to improve forest resilience to fire without a significant expected impact on owl occupancy rates.

In this way,  our work has critically informed the ongoing California Spotted Owl Conservation Assessment and the subsequent Conservation Strategy in Sierra Nevadan National Forests.

Please slide blue handle to compare the overlay with the high-resolution image below.

The map overlaid on a satellite image is an RGB-composite representing percent cover for three classes: Conifer (as red), Hardwood (as green), and Other (as blue or black) in Sequoia & Kings Canyon National Parks area.

California Spotted Owl Study Sites

More Details:

Koltunov, A. and C. Ramirez, (2015), “Reconstructing 20+ year history of subpixel forest canopy cover, structure, and disturbances at 30-meter scale with a suite of advanced Landsat image processing systems”. In 2015 Ecological Society of America Annual Meeting, August 9-14, 2015, Baltimore, MD, USA.

Tempel, D. J., Keane, J. J., Gutiérrez, R. J., Wolfe, J. D., Jones, G. M., Koltunov, A., Ramirez, C. M., Berigan, W. J., Gallagher, C. V., Munton, T. E., Shaklee, P. A., Whitmore, S. A., Peery, M. Z., (2016), “Meta-analysis of California Spotted Owl (Strix occidentalis occidentalis) territory occupancy in the Sierra Nevada: habitat associations and their implications for forest management”, The Condor: Ornithological Applications, 118: 747-765.